
15 · End-to-end performance verification and diagnosis
Use evidence from DNS, TLS/protocol, cache, origin transit, application, and Core Web Vitals to locate where a site is actually slow.
Edited and verified by Orange Book Editorial Team ·
Outcome
Every "the site is slow" report will produce the same evidence packet: URL, UTC time, region and network, protocol, CF-Ray, cache status, curl phase timings, browser HAR, Origin Analytics, and origin logs. The team can locate the layer instead of toggling features in turn.
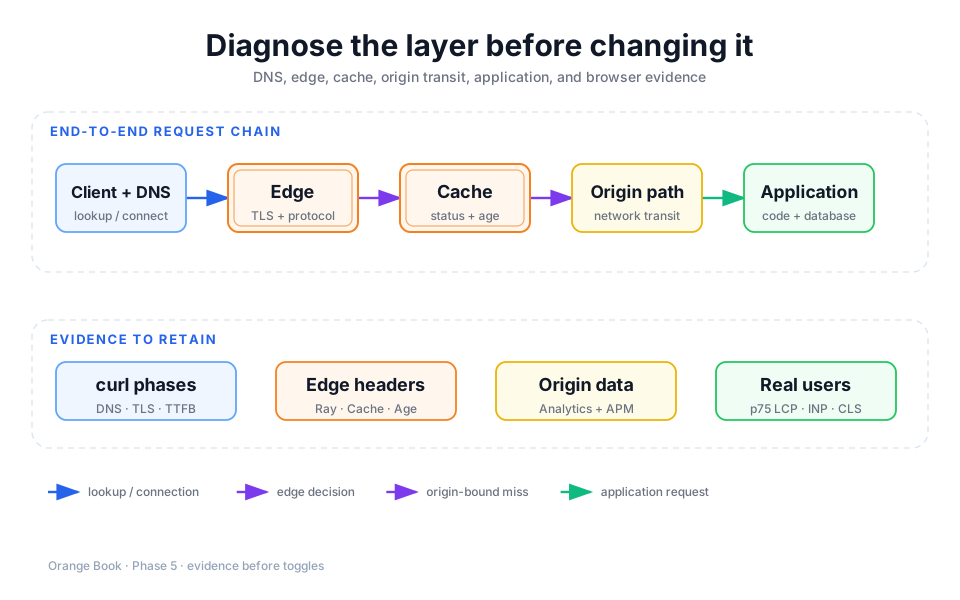
Detailed description
- 01DNS and connection
Inspect authoritative resolution, client network, TCP/QUIC, TLS, and HTTP protocol.
- 02Edge and cache
Use CF-Ray, CF-Cache-Status, Age, and rules to explain whether the origin was contacted.
- 03Origin path and application
Align Origin Analytics and origin APM to separate transit from server processing.
- 04Real page experience
Use p75 LCP, INP, CLS, and HAR to locate resource and main-thread problems.
Generate a command-line timing profile first
curl -sS -o /dev/null -D response.headers \
  -w 'dns=%{time_namelookup}\nconnect=%{time_connect}\ntls=%{time_appconnect}\nttfb=%{time_starttransfer}\ntotal=%{time_total}\nremote_ip=%{remote_ip}\nhttp=%{http_version}\n' \
  https://www.example.com/test-path
Run the same URL at least three times and retain first and subsequent samples. Record UTC, test region, network type, and VPN use. Preserve CF-Ray, CF-Cache-Status, Age, Cache-Control, status, and Server-Timing when the application provides it.
Locate the layer from the symptom
| Symptom | More likely layer | First evidence |
|---|---|---|
High dns or intermittent resolution | DNS/local resolver | dig, authoritative NS, DNSSEC, another resolver |
High connect/tls | Client network, protocol, TLS | Region, HTTP version, certificate, UDP fallback |
Static object always DYNAMIC | Cache eligibility/rule | Extension, Trace, response headers, Proxied state |
Same colo gets much faster after MISS → HIT | Edge Cache | CF-Ray suffix, Age, object version |
Fast HIT, slow page LCP | Frontend resources/main thread | HAR, LCP element, JS long tasks, image |
| High dynamic TTFB, low origin APM | Origin transit | Same-window difference between Origin Analytics and APM |
| High dynamic TTFB and high APM | App/database/external API | Path-level p95/p99, query and dependency traces |
| One region only | Client or long-distance path | Region grouping, Argo Analytics, mobile/Wi-Fi comparison |
Six-layer diagnostic workflow
Fix the problem definition
Write one URL, one observable symptom, its UTC window, affected region, and success threshold. "The whole site is slow" cannot produce a testable hypothesis.
Inspect DNS and proxy path
dig NS example.com +short
dig A www.example.com +short
Confirm nameservers, DNSSEC, and orange-cloud behavior. If one subdomain fails, do not switch the entire zone's nameservers.
Inspect TLS and HTTP protocol
Confirm HTTPS, HTTP/2 or HTTP/3 negotiation, and certificate state with curl or the browser. When HTTP/3 falls back to h2, inspect client and UDP network support before disabling the zone feature.
Inspect cache and rules
Request the same static URL repeatedly and combine Trace with DYNAMIC/BYPASS/MISS/HIT/UPDATING. A dynamic identity route remaining uncached can be the correct outcome.
Align Origin Analytics and origin logs
Origin Analytics includes Cloudflare's complete upstream round trip, while origin APM often measures only server processing. Align the same Path, UTC time, status, and Ray ID to separate transit from application work.
Return to real-user page experience
Observatory synthetic tests provide repeatability. Web Analytics/RUM p75 LCP, INP, and CLS reflect real visitors. Segment by Country, Browser, OS, URL, and Element rather than replacing a trend with one Lighthouse score.
Report cold and warm cache separately
The first Cloudflare test can be a MISS while a later run represents a stable HIT. Keep both. Cold-cache results answer what a new region or post-release request experiences; warm-cache results answer normal repeat traffic. Choosing only the fastest run hides origin and tiered-cache problems, while choosing only the first understates normal CDN benefit.
Minimum evidence packet
- Full URL with sensitive query values redacted, UTC window, region, ISP, and network type.
- At least three curl timing profiles and complete response headers.
- Browser HAR, Protocol column, LCP element, and Console errors.
- Cloudflare Trace plus Cache Analytics, Origin Analytics, or Argo Analytics export/screenshot.
- Origin access logs and application/database trace aligned by Ray ID or application request ID.
- Recent DNS, TLS, Cache Rules, release, origin, and third-party dependency changes.
Change one layer at a time
Enabling Argo, HTTP/3, Early Hints, Cache Everything, and image transformations together destroys attribution and expands rollback. Every experiment needs a hypothesis, metric, observation window, and stop condition.
For cache states, use the CF-Cache-Status handbook. For 5xx, use layered Cloudflare 5xx diagnosis. Completing this page finishes the 15-topic CDN learning path.
Primary sources
Did this page help you complete your goal?
Beta feedback is generated in this browser and is never uploaded automatically.
14 · Dynamic content acceleration and Argo Smart Routing
Distinguish origin processing from network-path latency and choose the right layer among cache, Tiered Cache, and paid Argo.
From a domain to your first complete application
Six verifiable stages cover domain setup, application development, data, defense, and production release.